EU Referendum
London’s ‘Remain’ vote in the EU Referendum
- Some boroughs were far more ‘pro-Remain’ than others
- Complex multiplicity of reasons for the variation
- Foremost factor was level of educational attainment
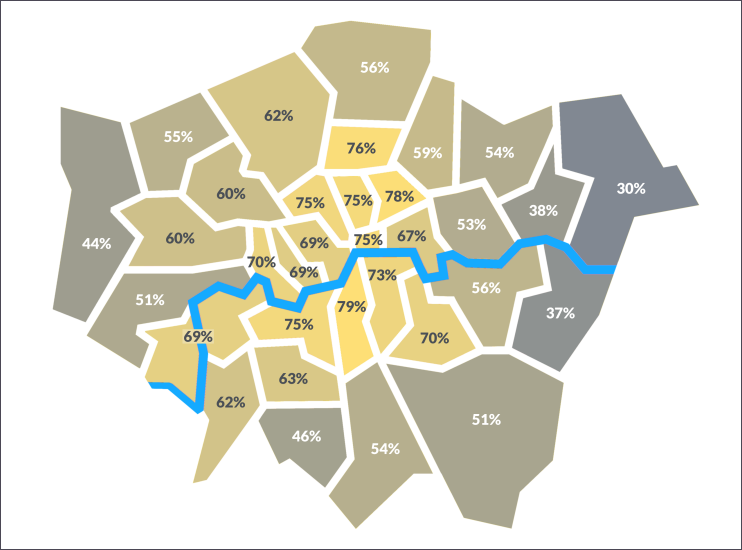
Unlike the nation as a whole, London voted decisively in favour of Britain’s continued membership of the European Union in the referendum held on 23 June 2016. More than than 2¼ million Londoners voted ‘Remain’, against just over 1½ million who voted ‘Leave’ – almost exactly a 60/40 split. But the ‘Remain’ camp’s strength varied widely across the capital.
The map above shows the percentage of ‘Remain’ voters in each London borough, and the City of London. As is immediately obvious from the shading, the variations within the capital were almost as great as they were in the country at large – from as low as 30 per cent in Havering to the giddy heights of 79 per cent in Lambeth.† This is a reflection of London’s disparate zonal demographics and related attributes.
Inner north London
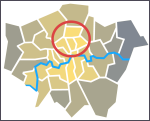 The clear support for ‘Remain’ in inner north London was probably the most predictable voting pattern of all the sub-regions.* Post-referendum polling shows that large majorities of voters who saw such things as multiculturalism, feminism and the green movement as forces for good wanted to remain in the EU – and inner north London has lots of residents who think this way. In addition, the research indicates that black British voters were more likely to choose ‘Remain’ than any other major ethnic group – and this group is well represented in Hackney and the eastern half of Haringey. Haringey also has a strong contingent whose families originated from south-eastern Europe.
Inner east London
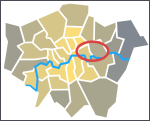 The boroughs of Tower Hamlets and Newham are extremely multicultural, with an especially populous south Asian community, notably of Bangladeshi origin in Tower Hamlets. Away from the riverside, these boroughs have high numbers of residents working in unskilled or semi-skilled jobs. Tower Hamlets ‘Remain’ vote was lower than in any other unequivocally inner London borough. Nevertheless, the split was greater than two-thirds ‘Remain’ to one-third ‘Leave’. Newham, which has one foot in outer London, was much less Europhile – and its voter turnout was the capital’s lowest, at 59 per cent.
Inner south London
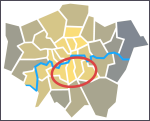 Lambeth supported ‘Remain’ more emphatically than any other area in the entire referendum except for Gibraltar. The borough has similar characteristics to much of inner north London, but with an added ingredient: this is increasingly an area of Spanish- and Portuguese-speaking residents – though many of them come from Latin America rather than Iberia. The same applies to Southwark’s Elephant and Castle locality too. Most of these new residents may not have had the right to vote, but Hidden London’s perception is that their presence is widely appreciated rather than resented. Neighbouring Wandsworth and Lewisham are also increasingly cosmopolitan boroughs (with numerous Antipodeans in Wandsworth) – and outward-looking attitudes prevail.
Inner south-west London
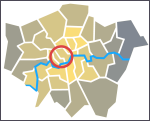 The boroughs of Westminster and Kensington & Chelsea did not plump as strongly for ‘Remain’ as the inner north and south boroughs. At first glance this may seem surprising. This part of London is surely the bastion of the ‘privileged elite’ who are so resented by many Brexiteers. But, unlike the zones above, this is solidly Tory territory and its residents are relatively old. Across the country, Conservatives and older people were more likely to choose ‘Leave’. Viewed in that light, it may be surprising that residents here voted as vigorously in favour of ‘Remain’ as they did.
Outer south-west London
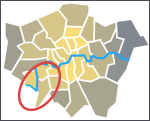 This corner of London supported the ‘Remain’ cause more strongly than any other outer London zone – especially Richmond upon Thames, where 69.3 per cent voted in favour despite its residents being relatively old. Why? Here we come to the single most significant factor in voter choice at the referendum. The evidence shows that being well educated (or still in full-time education) correlated unmistakably with ‘Remain’ voting. This held true nationwide, but particularly so in London. And Richmond residents tend to possess very good educational qualifications. Turnout in this zone was also stunningly high, at 78 per cent in Kingston and 82 per cent in Richmond.
Outer west London
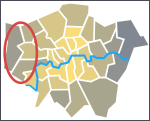 Hillingdon was the only borough in outer west London to prefer ‘Leave’ but it was close in Hounslow. It seems possible that the working-class Asian community in this part of London was relatively Eurosceptic, but the polling data is not robust enough to confirm this. What is certain is that Hillingdon – which is markedly white British in most of its northern half – is a borough with relatively low levels of educational attainment. As with other elongated boroughs, ‘Leave’ preferences in Hounslow and Ealing may have been distinctly stronger in the parts further from central London. The presence of Heathrow airport may have had an influence on some voters in this zone, but this could have been ‘Remain-positive’ because of local jobs or ‘Leave-positive’ because of the third runway issue.
Outer north London
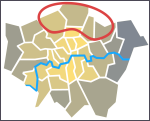 Voters in this zone were more ‘Remain-positive’ – and tend to be better educated – than anywhere else in outer London except the south-west. It is not clear why Barnet proved more Europhile than its neighbours to the east and west – unless it was simply because the borough stretches closer to inner London. Barnet’s most distinctive demographic characteristic is its populous Jewish community but there is no proof of a strong ‘pro-Remain’ preference among that group – indeed there is some evidence to the contrary, primarily because of negative opinions regarding the EU’s stance on Israel.
Outer east and south-east London
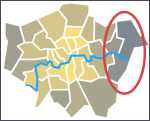 In almost all ways, this sub-region is the most atypical part of London: it is the least cosmopolitan and multicultural, with the lowest levels of educational attainment. Many older residents grew up in inner London and moved here as young adults. The demographic profile is overwhelmingly white British, though the western part of Barking & Dagenham has been changing. Like several of London’s outermost boroughs, Havering and Bexley have more in common with the counties beyond them than with central London – and they voted accordingly. Every district in Havering’s neighbour Essex voted ‘Leave’, as did all but one in Bexley’s neighbour Kent. Turnout was high in Havering and Bexley, indicating that voters felt strongly about their Eurosceptic stance. Further ‘inland’, Greenwich voted like (and has a demographic profile like) a cross between its dissimilar neighbours on either side, Lewisham and Bexley.
Outer south London
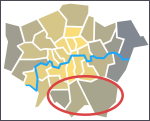 The boroughs of Sutton, Croydon and Bromley were collectively split 51/49 in favour of ‘Remain’, with a relatively high turnout. Although there are local variations (especially in north Croydon and in New Addington, where things are very different) this is broadly the most comfortably-off part of outer London. Bromley is a famously Conservative borough and much of it feels more like rural Kent than part of the metropolis, while diminutive Sutton has commonalities with the neighbouring Surrey stockbroker belt. Sutton voted out – though by a narrower margin than the other (demographically different) London ‘Leavers’. Many residents here are retired and own their homes outright, characteristics that tended to correlate with a ‘Leave’ vote. Relatively few possess higher educational qualifications.
Conclusion
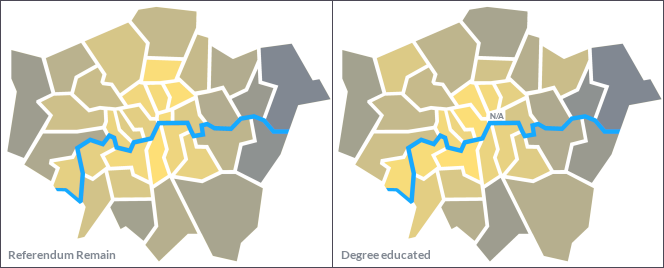
Multiple demographic and socio-economic attributes correlated partially with Londoners’ referendum voting choices, including affluence, age, socio-economic class, employment status and to some degree ethnicity. Even religion may have played a part, with people calling themselves Christians being relatively likely to vote ‘Leave’, while atheists and Muslims were more likely to vote ‘Remain’. However, across London the clearest correlation was to be found in the diversity of educational attainment. The boroughs with the densest concentrations of well-educated residents tended to be the places that most resolutely rejected the case for leaving the EU – and vice versa.
In the pair below, the map on the left has the same shading as the one at the top of this page: grading the ‘Remain’ share of the referendum vote from highest to lowest (darkest grey). The map on the right uses the same scale of shading to grade the boroughs of London by the percentage of economically active persons aged 16–64 with a degree or equivalent or above (as at 2014). They’re not a perfect match, because other attributes mentioned above doubtless also played a part – but they’re far closer than any other pairing.
Sources: Information on referendum voters’ characteristics is primarily drawn from Lord Ashcroft’s ‘How Did You Vote?’ poll. Information on boroughs’ demographic, economic and social characteristics is primarily drawn from the London Datastore’s borough profiles. BBC News gathered and analysed data for individual wards (where possible) in February 2017, and drew broadly similar conclusions to those above.
See also Hidden London’s page on London demographics.
† TV news broadcasters seeking vox pops from Remainers and Brexiteers regularly take their cameras to the boroughs of Lambeth and Havering respectively. According to the 2011 census, a Lambeth resident is four times more likely to have a degree than a Havering resident.
* Inner north London takes in several localities that sections of the media love to stereotype as the favoured resorts of the ‘liberal intelligentsia’ (at best) or the ‘chattering classes’ and ‘champagne socialists’. Places like Islington and Hampstead, though the latter is now too expensive for all but premier cru champagne socialists. Plus hipsters in Shoreditch and Hoxton and assorted alternative types in and around Camden Town.
