Demographics
London’s local demographics
Highlights from the 2011 census
The Office for National Statistics released ward level population figures from the 2011 census on 30 January 2013, broken down by religion and ethnicity.

Population
Local government boundaries are usually drawn so as to include roughly the same number of voters in each of a borough’s wards, so not much can be inferred from the total number of residents of any individual ward at one point in time. However, changes in ward populations between 2001 and 2011 are sometimes revealing.
Very few London wards have experienced a decline in population. Those that have are either out in the sticks (like Biggin Hill or Selsdon) or in the very wealthiest central parts (such as Hans Town and Brompton). In the latter case, these localities are tending to get even wealthier and an increasing number of properties may not be their owners’ primary places of residence.
The only working-class, inner-city locality to have undergone a population decline is Walworth, where ambitious redevelopment schemes have been preceded by wholesale ‘decantation’ of residents from blocks of flats scheduled for demolition.
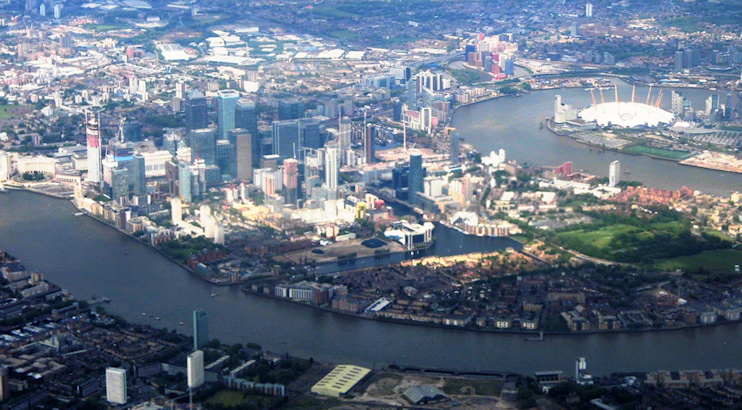
The fastest growing places have been Westminster’s Church Street ward and Tower Hamlets’ wards of Millwall and Blackwall & Cubitt Town. Between them, the latter pair cover the whole of the Isle of Dogs – where mountain ranges of apartment blocks have been erected in recent years. Church Street’s growth, however, seems to have resulted from increases in household size: this is now a very overcrowded locality.
Ethnicity and nationality
Already one of the world’s most cosmopolitan cities, London has gained even greater diversity over the past decade.
Quite a few wards in boroughs like Havering, Bexley and Bromley had a 90 or even 95 per cent white British composition in 2001. Now, no ward in London is 95 per cent white British and only four remain above 90 per cent: Bromley’s Biggin Hill and the extraordinarily rural Darwin (centred on Downe) and Havering’s Upminster and Cranham.
Dollis Hill has the greatest number of Irish residents of any ward in London, followed by Mapesbury, Fryent, Kilburn and Willesden Green, all in the London Borough of Brent.

The wards with the largest Indian communities are Ealing’s Southall Green and Southall Broadway and Brent’s Wembley Central and Alperton. There are, however, significant differences between those two boroughs’ Indian communities. In Ealing (Southall), Sikhs are the largest religious group, though there are also many Hindus and Muslims. Brent’s strongly Indian wards are mainly Hindu, with relatively few Muslims and very few Sikhs.
Redbridge’s Loxford ward – located between Ilford and Barking – has the greatest number of residents of Pakistani birth or descent. Neighbouring Clementswood ward comes next. After those come three wards on the east side of Newham.
Members of the Bangladeshi community overwhelmingly choose to live in Tower Hamlets or, failing that, Newham. In Tower Hamlets’ wards of St Dunstan’s and Stepney Green, Shadwell, Bromley-by-Bow and Bethnal Green South more than 40 per cent of residents are of Bangladeshi heritage.
The ward of Thamesmead Moorings has by far the most residents of black African descent. Peckham, which used to top that list, now comes second.
Croydon’s Thornton Heath has the most residents of black Caribbean descent, followed by Lewisham’s Catford South and Croydon’s Bensham Manor (which is actually just more of Thornton Heath). Next come two of the better known centres of Caribbean culture: Lambeth’s Coldharbour ward (in Brixton) and Brent’s Harlesden.
As in many parts of Britain, London has a growing number of residents of mixed ethnicity, especially south of the river in the boroughs of Lambeth, Lewisham and Croydon. The latter’s adjoining wards of Woodside and Selhurst have the highest populations in the ‘mixed/multiple ethnicity’ group, of whom most are of mixed white and black Caribbean parentage.
No longer drawn to Soho or Little Italy, except perhaps for Sunday worship, London’s Italians are inclined towards the streets north of the Fulham Road, especially those in West Brompton’s Redcliffe ward, which has many residents from elsewhere in continental western Europe too. The adjoining Courtfield ward and Westminster’s Lancaster Gate also have marked concentrations of western Europeans.
Enfield and Haringey constitute London’s Turkish heartland. All the top 20 ‘most Turkish’ wards are in those two boroughs and Edmonton is the capital of London’s Ottoman empire.
Only one ward in London has more than a thousand residents of Greek or Greek Cypriot origin: Enfield’s Palmers Green. Cockfosters, also in Enfield, and Barnet’s Brunswick Park have the next largest Greek populations.
Westminster’s Hyde Park ward has London’s largest Arabic population, followed by the neighbouring Church Street ward, which also has a Kurdish community.

Maintaining a tradition that dates back more than half a century, Ealing is by far the most popular borough for London’s Polish community. Nine of the top ten ‘most Polish’ wards are in Ealing – mostly in the borough’s northern sector – with Perivale at the top of the list, followed by Greenford Green. This author once boarded a break-of-dawn Polish minibus service from Ealing Broadway to Stansted airport: the tour of pick-ups in and around Greenford took longer than the entire remainder of the journey.
Wandsworth’s Thamesfield ward – which takes in the part of Putney lying north of the Upper Richmond Road and the north-west corner of Wandsworth itself – has the most Australians and New Zealanders. It’s followed by East Putney and the Battersea wards of Northcote and Shaftesbury, all in the London Borough of Wandsworth. Clapham, Balham and Shepherd’s Bush are also antipodean hotspots.
In the London Borough of Kingston upon Thames, New Malden’s two wards (Beverley and St James) have London’s greatest numbers of Koreans. The next four ‘most Korean’ wards are all near neighbours of New Malden.
London’s Nepalese community has plumped for Plumstead. While most of the capital’s wards have fewer than ten Nepalese residents, Plumstead has 1,687 and the adjacent Glyndon ward has another 1,093. These two wards, which account for 0.2 per cent of London’s total population of 8.2 million, have 13 per cent of the city’s Nepalese (including Gurkhas).
Other distinctive ethnic demographics in brief:
- London’s Gypsy/Traveller community is small; it is most heavily concentrated in Bromley’s wards of Cray Valley East and West
- Hanger Hill has the most Japanese residents
- The greatest numbers of Chinese are to be found on the Isle of Dogs and in Bloomsbury and neighbouring King’s Cross; many in the latter localities are presumably students
- The top three wards for Latin Americans are Kensal Green, Willesden Green and Oval (Kennington)
- Stonebridge has London’s largest Somali community
- Barking & Dagenham’s Gascoigne ward has the most Albanians
- Filipinos favour Catford
- Estonians, Latvians and Lithuanians have gravitated to the southern and western wards of Newham
- Harrow’s wards of Roxbourne and Rayners Lane have the greatest concentrations of Tamils
- North Americans come together in Westminster’s Abbey Road
- The City of London’s tiny Queenhithe and Tower wards have the highest percentage of Russians, followed by Westminster’s Knightsbridge and Belgravia ward
- Newham’s Wall End has the most residents of Sri Lankan descent
Religion (or lack of it)
The five least religious wards are all in the same neck of the woods: Haringey’s Stroud Green, Crouch End and Muswell Hill and Hackney’s Clissold and Stoke Newington Central. In heathenmost Stroud Green 42.7 per cent of residents declared that they followed no religion, compared with 36.5 per cent who professed Christianity, 11.4 per cent who were adherents of other religions and 9.4 per cent who chose not to answer the question. Sixth in the irreligious league is the City’s Aldersgate, where John Wesley felt his heart strangely warmed and went on to found what became the Methodist Church in nearby City Road.
The most religious wards are Ealing’s Southall Green and Southall Broadway, where only 2 per cent of residents have no faith and Sikhism is at its strongest.
London’s most Christian locality is Upminster, where 75 per cent of residents stated their adherence to that faith.
London’s most Muslim wards generally correspond with those where the Pakistani and Bangladeshi communities are most numerous, and are all in east London: St Dunstan’s and Stepney Green, Green Street East and West, Loxford, Little Ilford, Shadwell and Bromley-by-Bow.

The capital’s Jewish community favours Barnet above all other boroughs, especially the wards of Golders Green, (Hampstead) Garden Suburb, Hendon, Edgware and Finchley Church End. After these five, the largest numbers of Jewish residents are to be found in Hackney’s wards of Springfield and New River, which take in Stamford Hill.
Barnet’s Mill Hill – for centuries home to religious nonconformists of many shades – has the most Zoroastrians, but there are only 36 of them here, representing 0.2 per cent of the ward’s total population. The faith has 34 adherents (0.3 per cent of a smaller population) in Harrow’s Rayners Lane ward, where a former cinema has been converted into a Zoroastrian centre.
A few other notable religious demographics:
- Lewisham’s Evelyn ward (in Deptford, which has a significant Chinese presence) has the most Buddhists
- Adherents to India’s Jain faith are especially concentrated in Kenton
- Brockley has the most Jedi Knights (122)
- Barnet’s East Finchley has the most Taoists, all eleven of them
- Lambeth’s Brixton Hill has the most Voduns, but that’s only four, which could possibly be just one household
See also the pages on London’s projected 10-year population growth and languages spoken in London’s workplaces.
